

Oct 18, 2026 · @Jordan Johnson
Hospitals are running out of room for error. According to Kaufman Hall’s latest National Hospital Flash Report, the average hospital operating margin dropped to 1.8% in August 2026, and about 43% of U.S. hospitals are now operating in the red (Becker’s Hospital Review). Expenses are up 21% over three years. Bad debt and charity care keep climbing.
In that environment, the most painful dollar to lose is the one you already earned. And in radiation oncology, earned revenue goes uncollected every month, quietly, in amounts too small for anyone to notice.
That is the problem Bridge Oncology was built to solve.
A service line the system was not built for
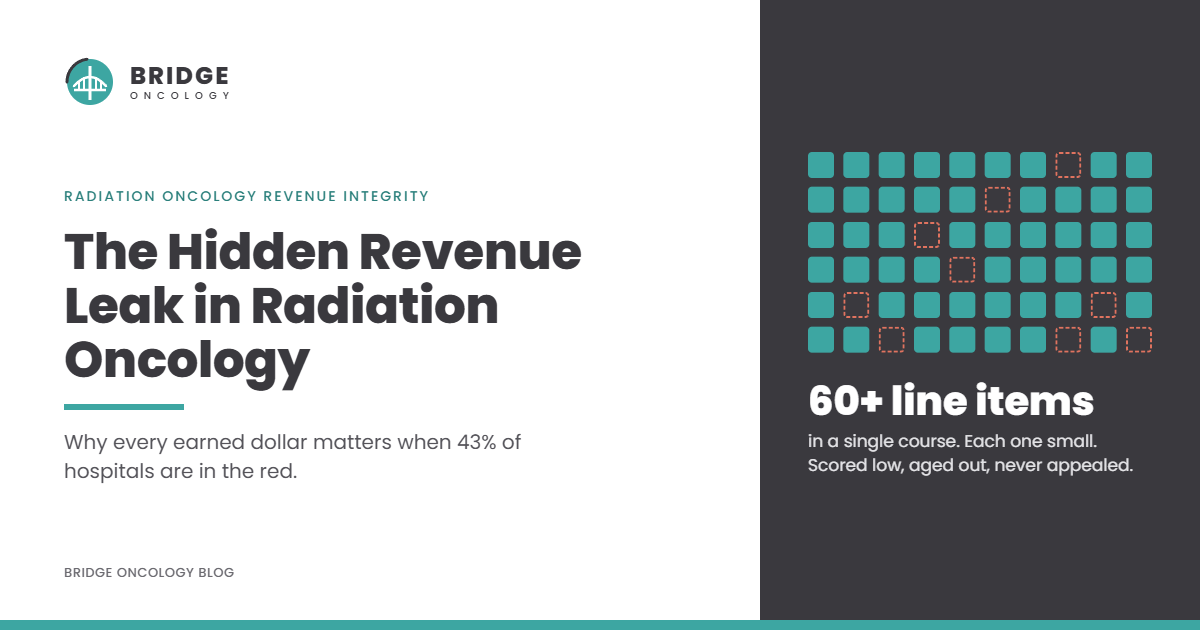
Hospital revenue cycles were designed around a few large claims. Radiation oncology is the opposite. A single 25-fraction image-guided course generates at least 60 treatment-phase line items before simulation and planning are counted. Each line is small. Together, they make up a substantial service line.
That mismatch creates what Bridge calls the scoring trap. Work queues in Epic typically rank accounts by dollar amount, so radiation oncology lines sink to the bottom. They get pushed down as larger accounts arrive, age past timely filing limits, and are eventually written off or denied as untimely. No one decided to lose that revenue. The build simply never put it in front of anyone.
Other enterprise rules compound the problem. Many hospitals skip appeals on hospital billing denials under a set threshold, often $1,000, and most individual radiation oncology lines fall below it. Claims are judged one at a time, so a single course-level issue, like a documentation gap, appears as dozens of tiny denials, one per fraction, none big enough to fix. And payers are often billed the same way even when some cover services like adaptive planning and others do not.
Meanwhile, the department is told it owns reconciliation and follow-up, but it usually has no work queue access, no edit visibility, no RO-level reporting, and no funded staff. The Central Business Office works queues built for different revenue. The charge leaves the department, and ownership ends.
Why software alone will not find it
Under margin pressure, the reflex is to buy another tool. Dashboards, denial management platforms, benchmarks, and AI coding products all have value. But they share one limitation: they read the data the system already produces.
If a charge never dropped, the denial tool never sees it. If an edit is holding a whole course, the dashboard shows nothing unusual. If a line was scored to the bottom of a queue and aged out, the report shows a clean write-off. AI coding tools can match patterns on the record they are given, but they miss the clinical context that drives radiation oncology billing: a boost, a re-plan, five-fraction counting for codes like 77427 and 77336, or which payers cover adaptive planning.
Software reports. It cannot judge. And it cannot sit beside the coder, the biller, the authorization specialist, and the physicist to see what actually happens at the keyboard.
The Bridge approach: a clinical team at the screen
Bridge Oncology deploys a clinical radiation oncology team on site, with expertise in RO coding, clinical operations, medical physics, and revenue cycle. The team spends a day in the department and a day inside the CBO and Epic, opening work queues, edits, and reports live. Then it traces real treatment courses from the treatment record to the claim to the remittance, naming every point where revenue leaks and sizing it in dollars.
Because Bridge sits on neither side, it can open what the department cannot reach and look at what the CBO has never examined through a radiation oncology lens. People describe their process the way it was designed. At the screen, you see how it actually runs: the queue no one opens, the filter that drops RO accounts, the edit holding every IMRT plan, and the two people quietly fixing everything by hand.
The stakes are real. In Bridge’s illustrative model of a mid-sized program with about 1,000 courses a year, five common leakage points add up to roughly $349,500 annually, about $29,000 every month. Those figures are assumptions, replaced with actual data during each review. But consider them against today’s margins: at 1.8%, a hospital would need about $19.4 million in new revenue to produce the same bottom-line impact.
Finding the leak is only half the job. Codes change every January, NCCI edits change quarterly, payers revise policies mid-year, and staff turn over. So Bridge closes the loop. Each finding is traced to its root cause, fixed at the source, taught to the responsible team, and monitored monthly until it holds. The engagement delivers working tools, including a build map, a 180-day work plan, a staffing case, and an RO CPT playbook. The ongoing Revenue Integrity Program is designed to hand off to the organization’s own dedicated RO team, not create a permanent dependency.
Every point of margin counts
With 43% of hospitals losing money, leaders cannot afford to let earned revenue disappear into a gap no one owns. Radiation oncology clinicians have already delivered the care. What is missing is the clinical knowledge and neutral standing to follow each charge from the department to the denial, and to keep that path open.
The test is simple: compare recovered and prevented losses with the cost of the work. To find out where your radiation oncology revenue cycle is most likely leaking, schedule a discovery call with Bridge Oncology.